Industry
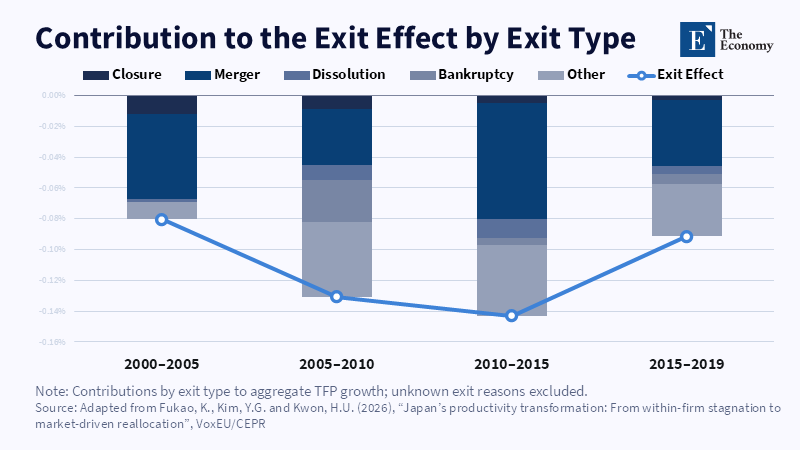
Mergers account for a large share of Japan’s negative exit effect. Related Articles: Why Japan Keeps Productive Small Firms Small | The Economy
Read More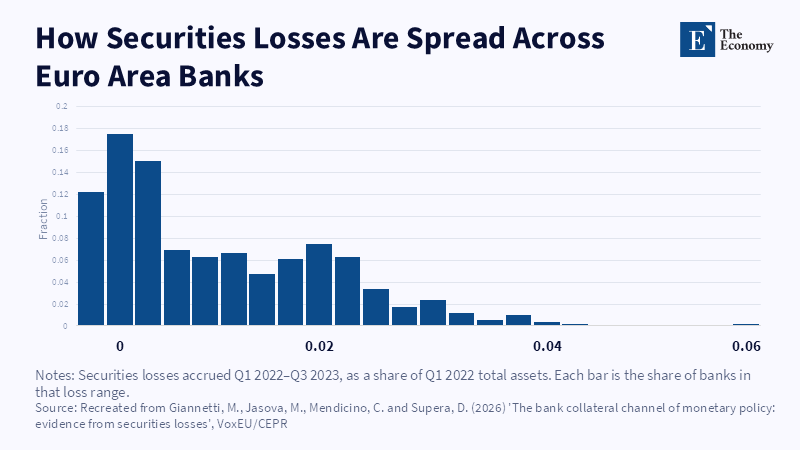
Most banks took modest losses, but a long tail of heavily exposed banks drove the pullback. Related Articles: The Collateral Channel Problem
Read More
College-educated immigration expanded rapidly as growth among the least-educated reversed. Related Articles: Low-Skill Immigration Isn't the Wage Lever Was
Read More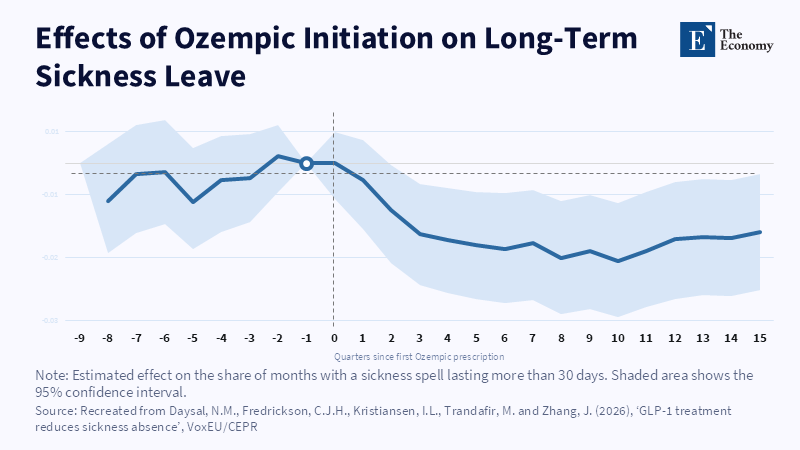
Long-term sickness absence falls after Ozempic initiation, with the reduction strengthening over time. Related Articles: GLP-1 Healthcare Coverage:
Read More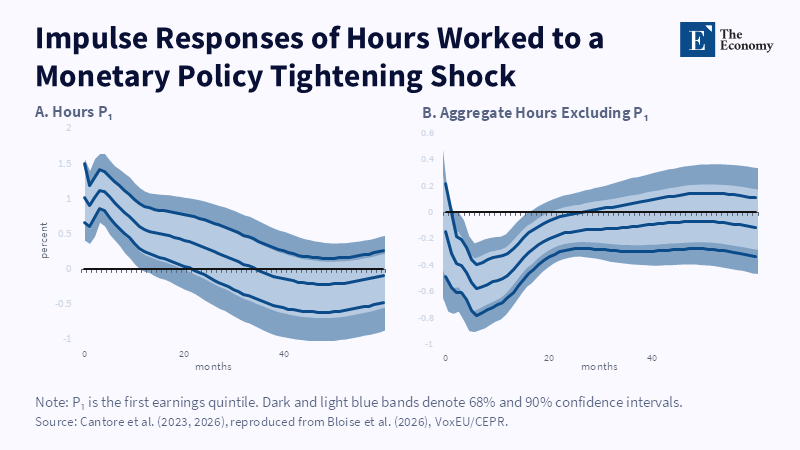
Lower-paid workers increase hours after tightening even as hours fall across the rest of the workforce. Related Articles: Labor Supply During
Read More


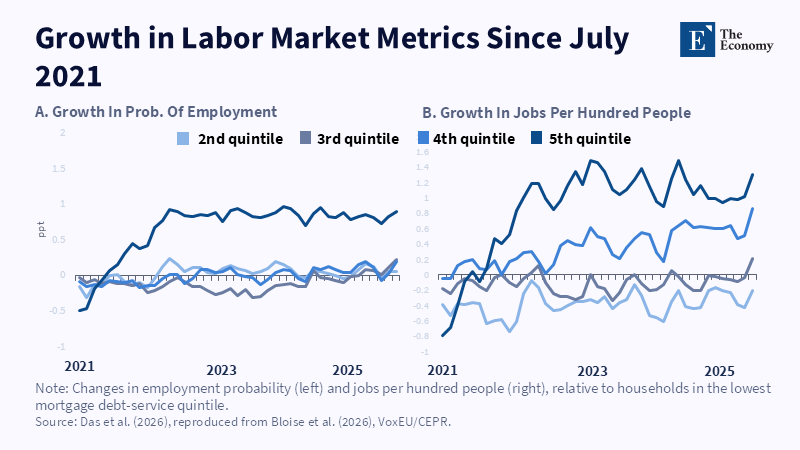
More mortgage-exposed households increased employment and took additional jobs as interest rates rose. Related Articles: Labor Supply Durin
Read More
Source: Commercial Aircraft Corporation of China (COMAC) supplier list; Center for Strategic and International Studies (CSIS), “C919 Major Suppliers”; Airframer aircraft supply-chain database Related Articles:
Read More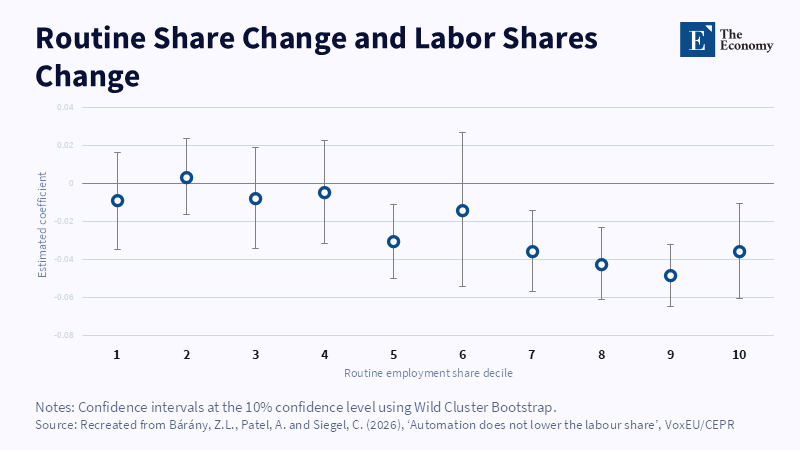
Routine employment declines are not matched by the predicted declines in firms’ labour shares. Related Articles: Automation and Labor Share: Wh
Read More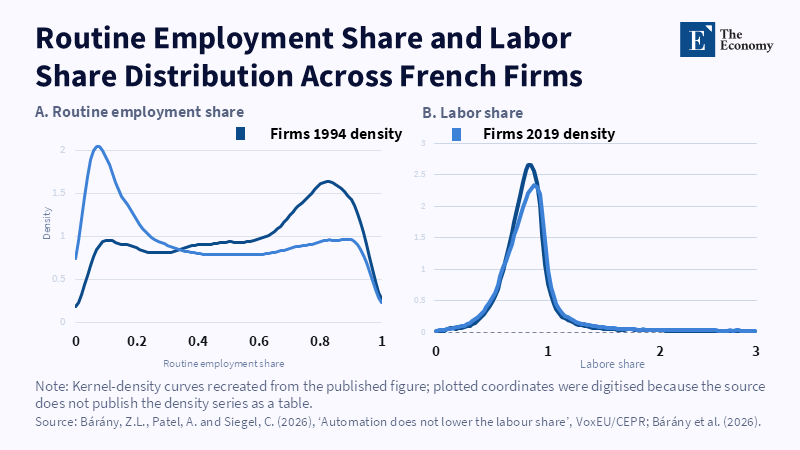
Routine work declined sharply, yet the distribution of firms’ labour shares remained remarkably stable. Related Articles: Automation and Labor Sh
Read More
Related Articles: “Melting Ice Ignites Arctic Arms Race”: Canada Accelerates Type 212CD Partnership With Germany and Norway | The Economy
Read More
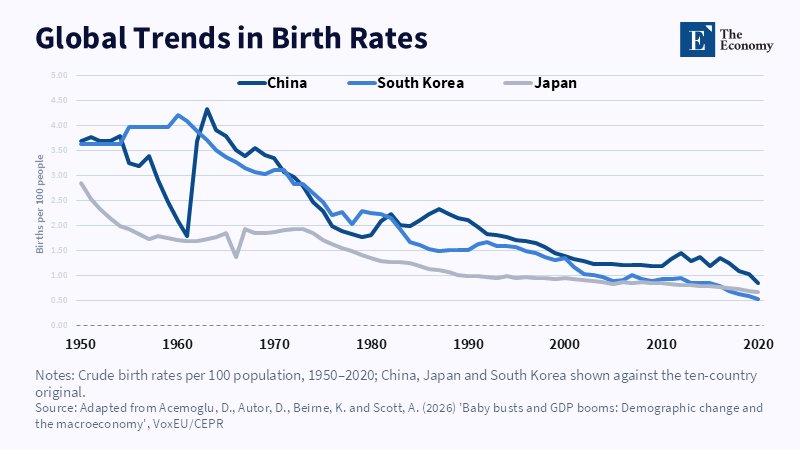
China, Japan, and South Korea have driven the sharpest declines among the world's largest economies. Related Articles: How Labor Scarcity Can Turn Populatio
Read More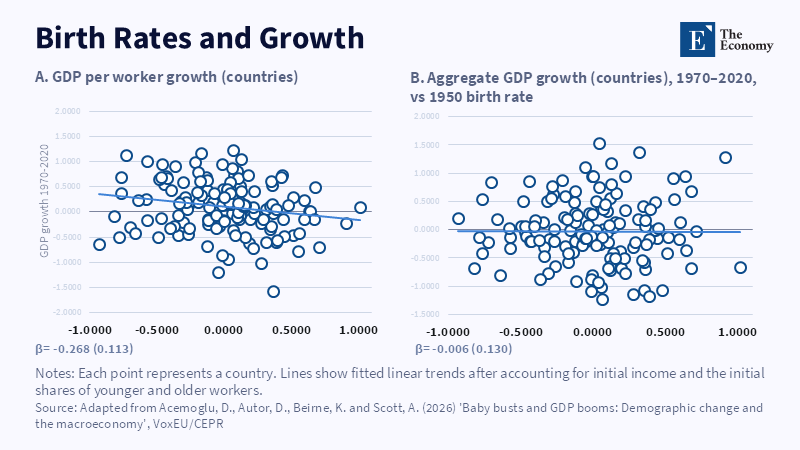
Lower birth rates predict higher per-worker growth, but no comparable lift in aggregate GDP. Related Articles: How Labor Scarcity Can Turn Population Decli
Read More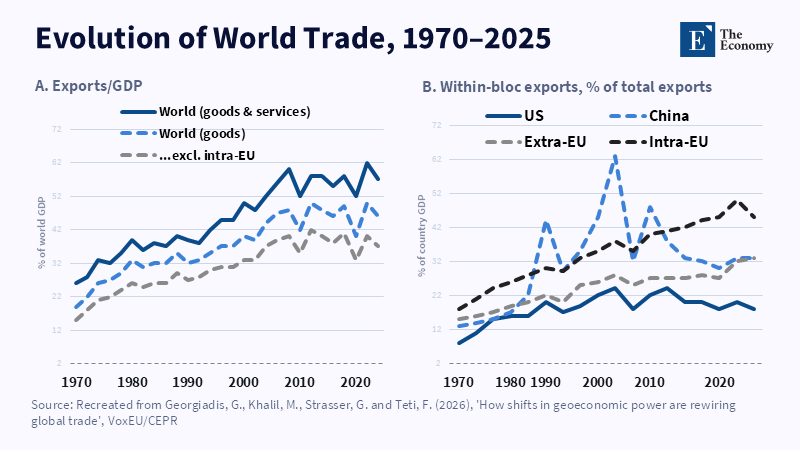
China's trade openness spiked and partly retreated after its mid-2000s export boom.
Read More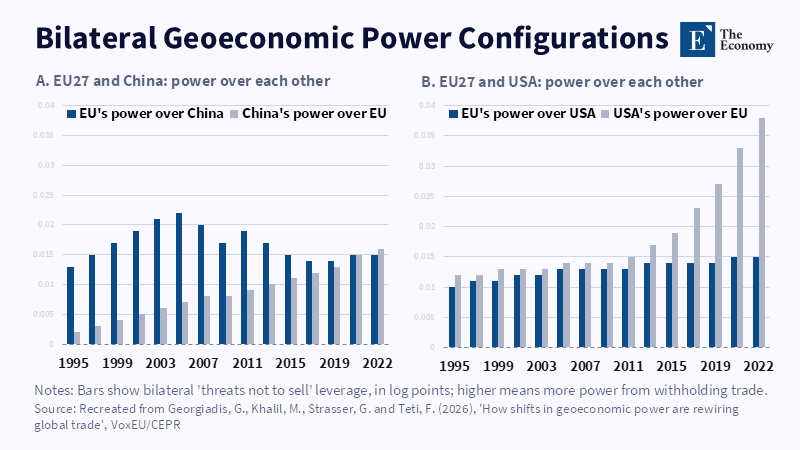
The EU to China leverage gap has closed almost completely.
Read More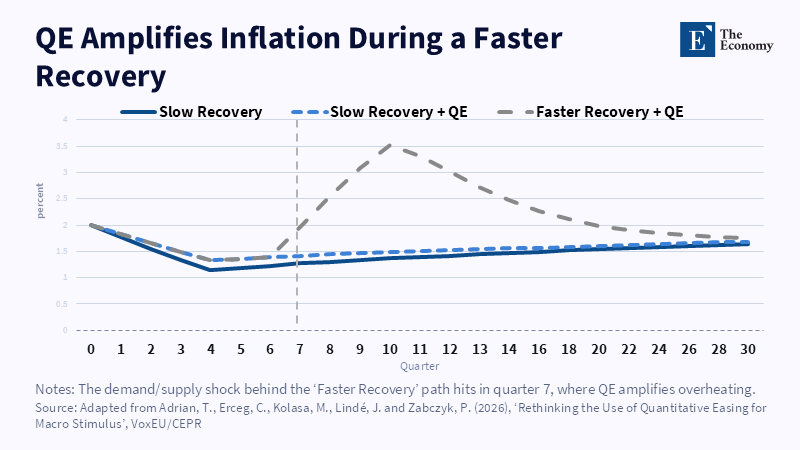
QE has little additional inflation effect during a slow recovery, but a faster rebound produces a sharp, temporary overshoot. Related Articles:
Read More
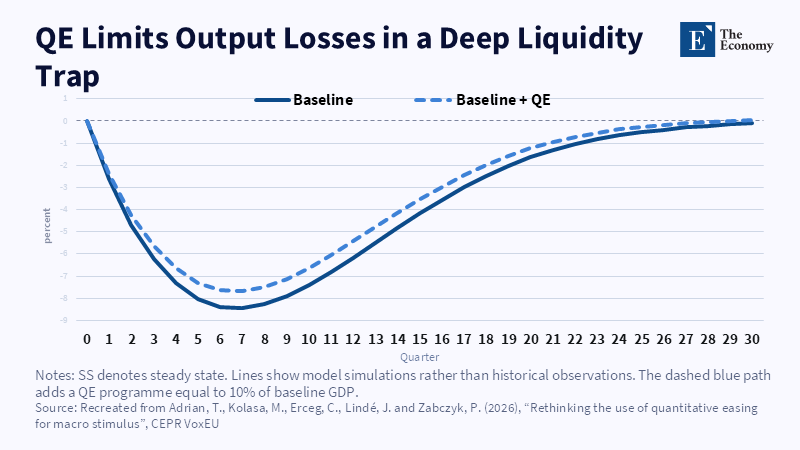
QE cushions the output decline in a deep liquidity trap, keeping output above the no-QE baseline throughout the recovery. Related Articles:
Read More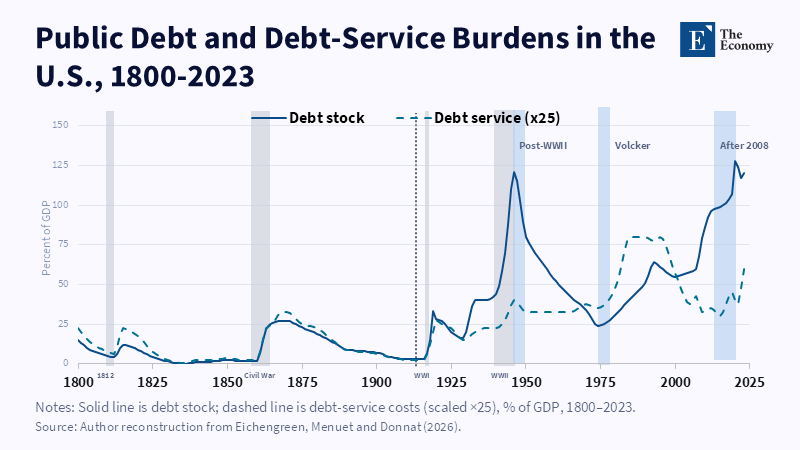
The lines split hard twice: debt soars after WWII while service costs barely move; service costs soar in the 1980s while debt stays flat. Related Articles:
Read More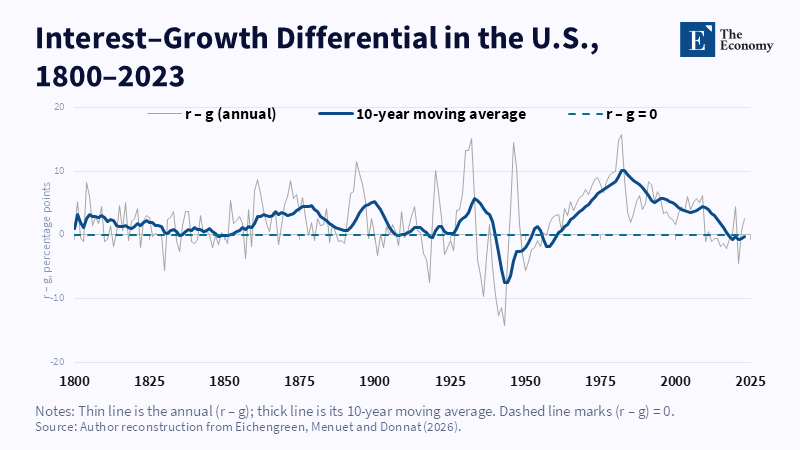
Every stretch above zero, especially the 1980s, lines up with real fiscal tightening.
Read More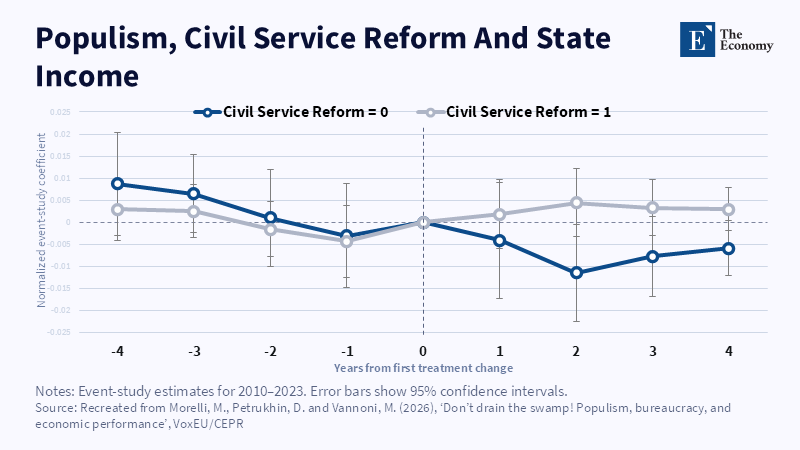
Civil-service protections appear to absorb the income damage linked to populist rule. Related Articles: Civil Service Independence: The Overlooked S
Read More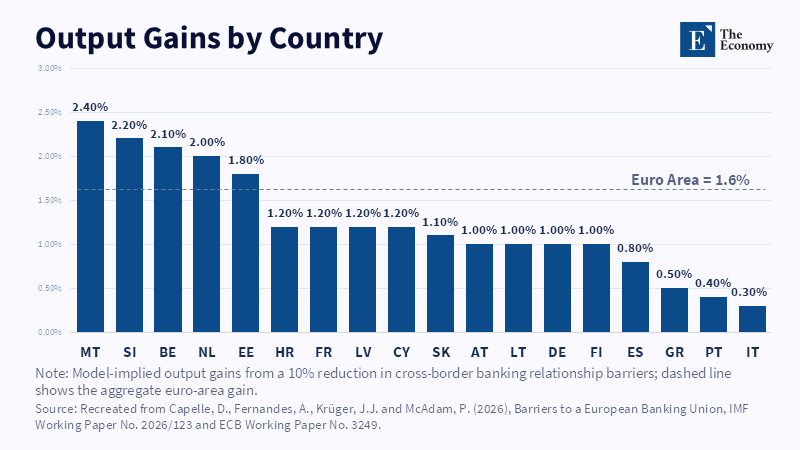
Lower cross-border banking barriers raise output across the euro area, although the gains vary sharply by country. Related Articles:
Read More