Industry
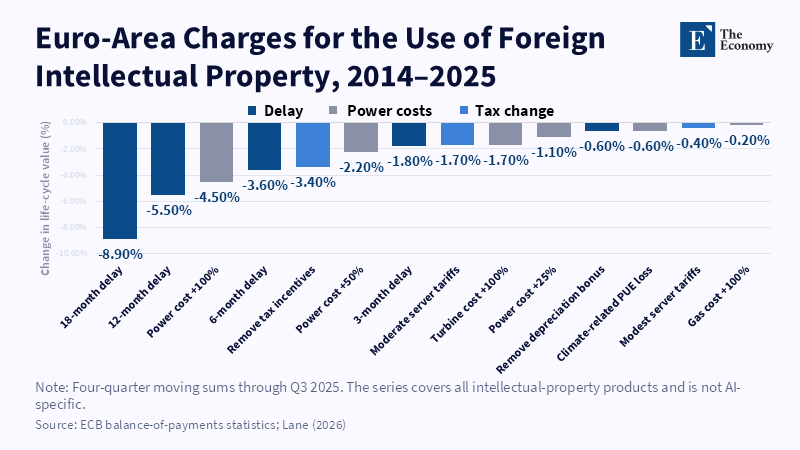
Note: Delays destroy more project value than higher electricity costs, making time to power a central constraint. Related article: Europ
Read More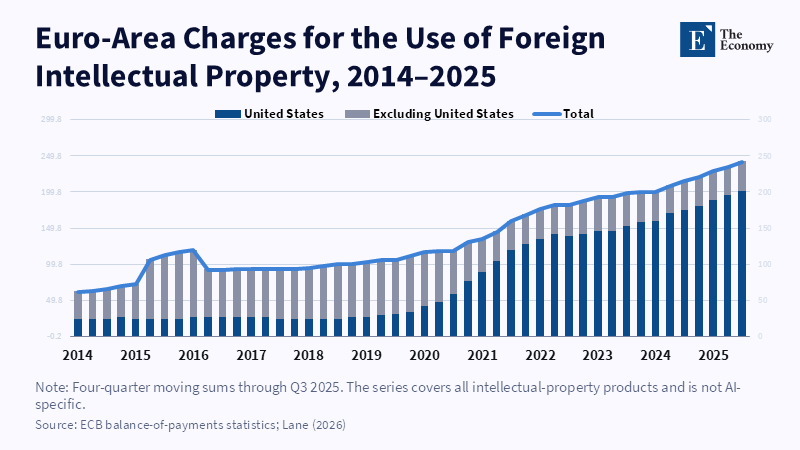
Note: Foreign-IP payments show how technology adoption can rise without equivalent domestic fiscal capture. Related article: Europe’s AI
Read More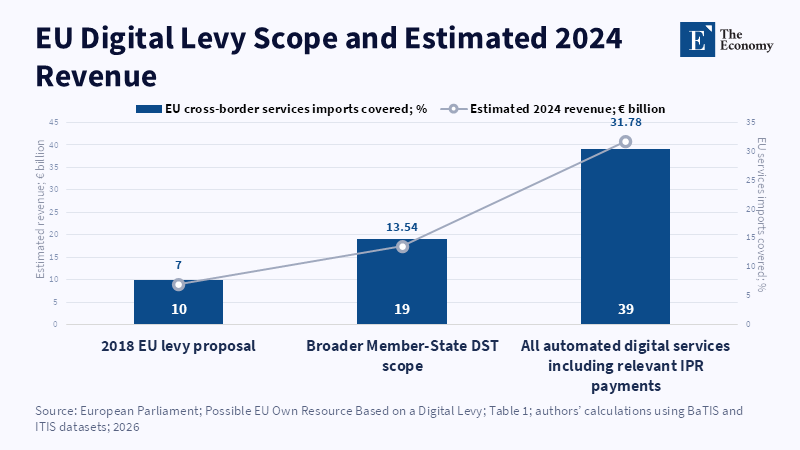
Note: Broader coverage raises more revenue but turns the levy into a wider tax on cross-border digital services. Related article: Taxing AI
Read More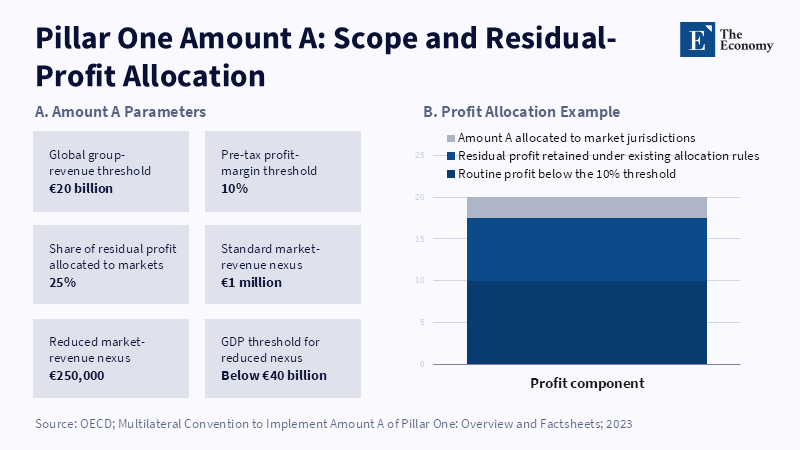
Note: Amount A would reallocate only 25% of profit above the 10% profitability threshold to eligible market jurisdictions.
Read More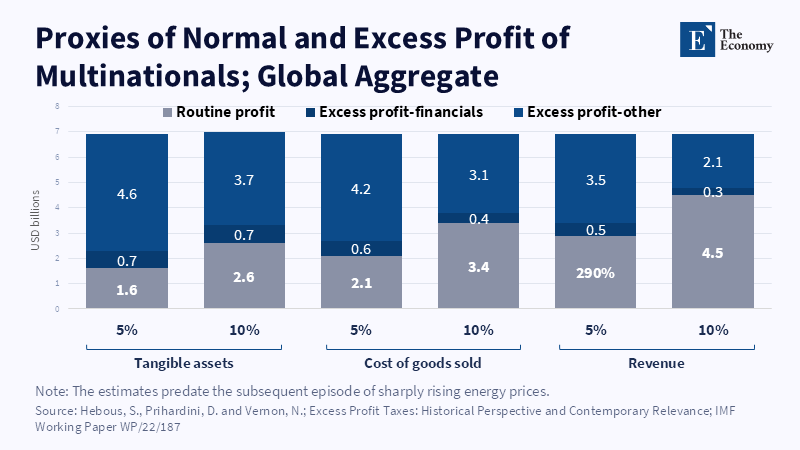
Note: The measured share of excess profit changes sharply with the benchmark used to define a normal return. Related article: Taxing AI Profi
Read More


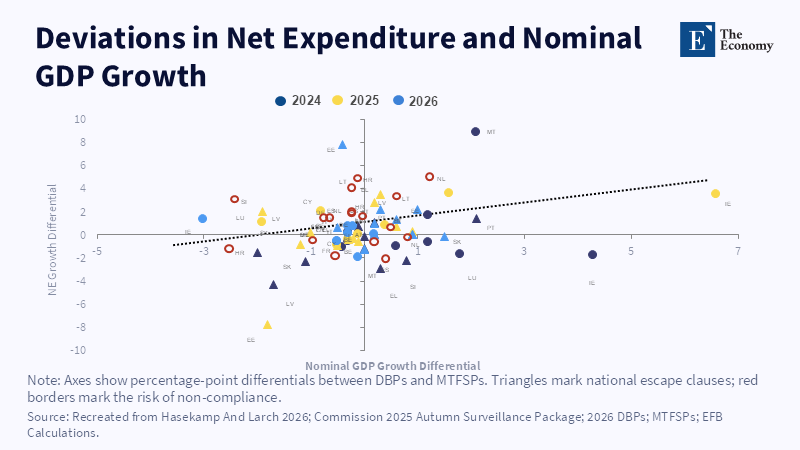
Note: Most observations remain procyclical, showing that expenditure plans still respond to short-term growth surprises.
Read More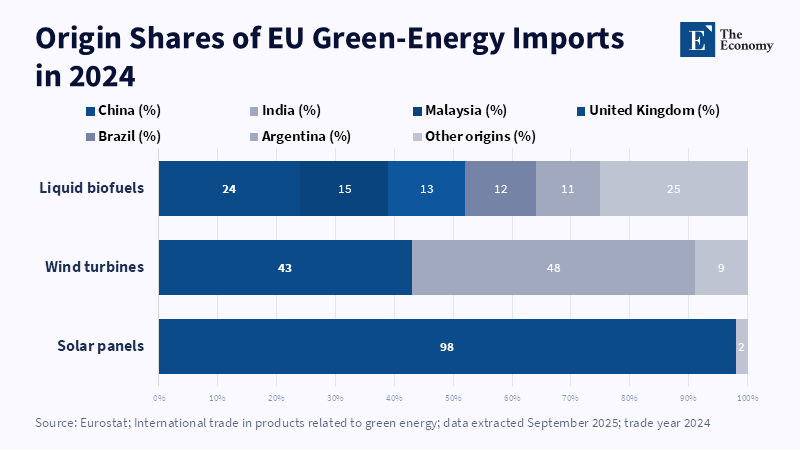
Note: Solar-panel sourcing is almost entirely concentrated in China, while wind turbines and liquid biofuels have broader—but still concentrated—supplier structures. Related article:
Read More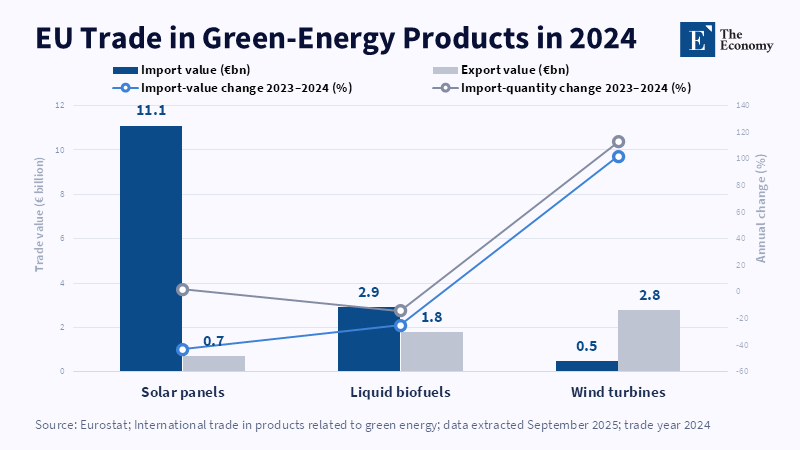
Note: Solar panels remain strongly import-oriented, whereas wind turbines retain an export surplus and recorded rapid growth in both import value and quantity. Related article:
Read More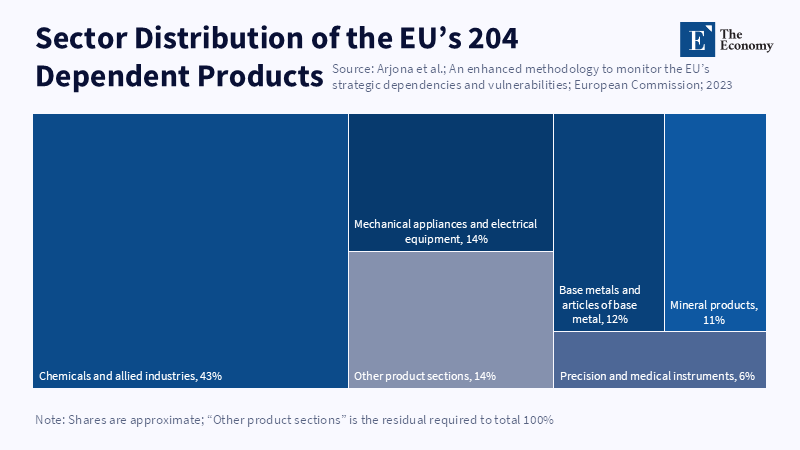
Note: Chemicals account for the largest dependency share, while machinery, metals, minerals, and precision goods together represent nearly half of identified products. Related article:
Read More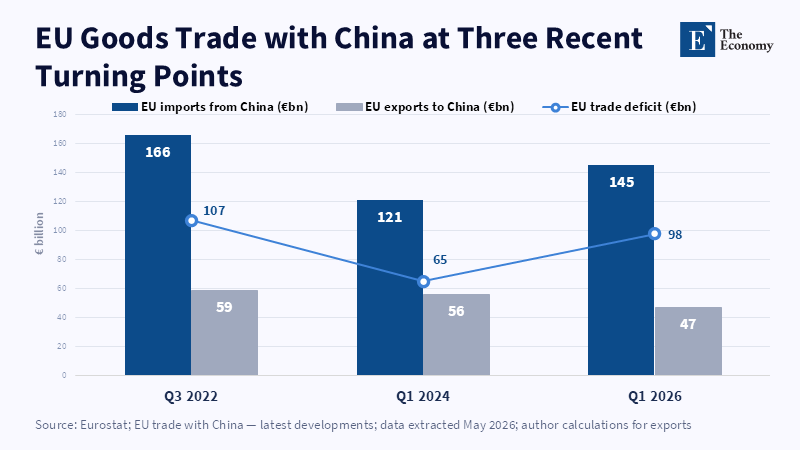
Note: The EU–China goods deficit narrowed after 2022 but widened again by Q1 2026 as imports recovered and exports weakened. Related article: [EU vs.
Read More
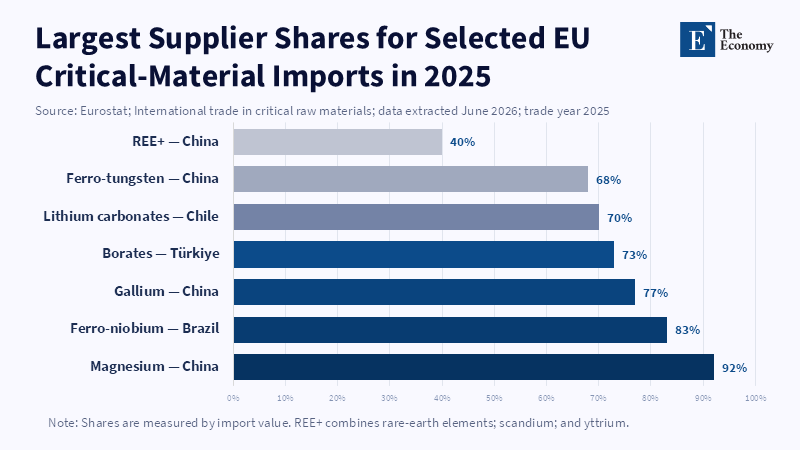
Note: Critical-material risk becomes strategic when supplier concentration meets weak substitution options. Related article: Europe’s China Risk Is Not
Read More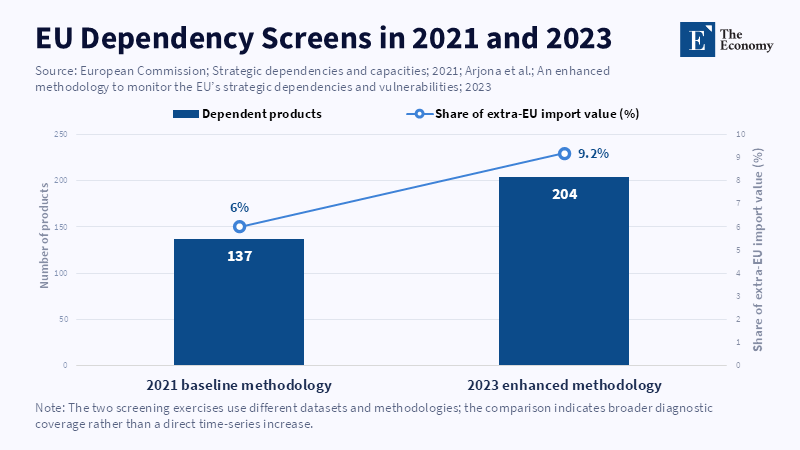
Note: Better screening shows that Europe’s dependency problem is narrower than headline import shares suggest. Related article: Europe’s China Risk Is N
Read More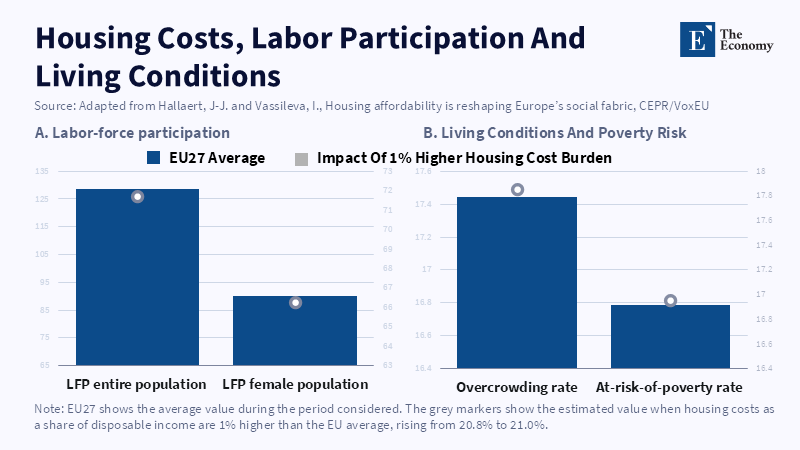
Figure 1: Even a small rise in the housing-cost burden is linked to lower labour-force participation and worse living conditions, reinforcing housing as a labour-market constraint. Related article:
Read More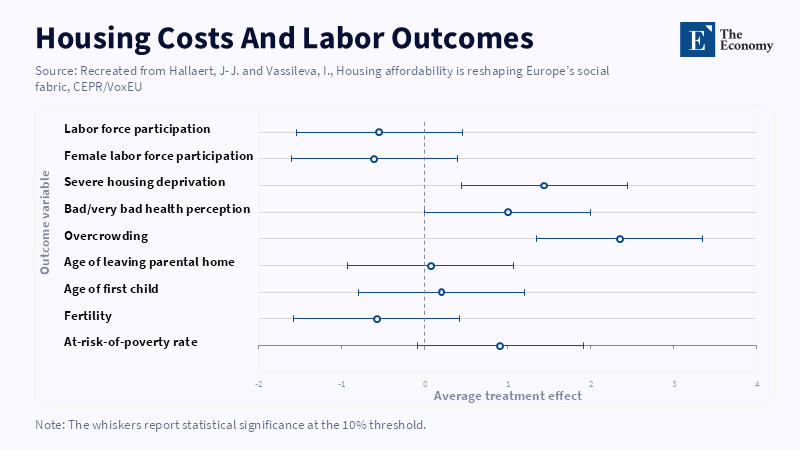
Figure 1: Higher housing costs are associated with weaker labour participation and wider social strain, especially overcrowding, housing deprivation, poverty risk and health pressure. Related articl
Read More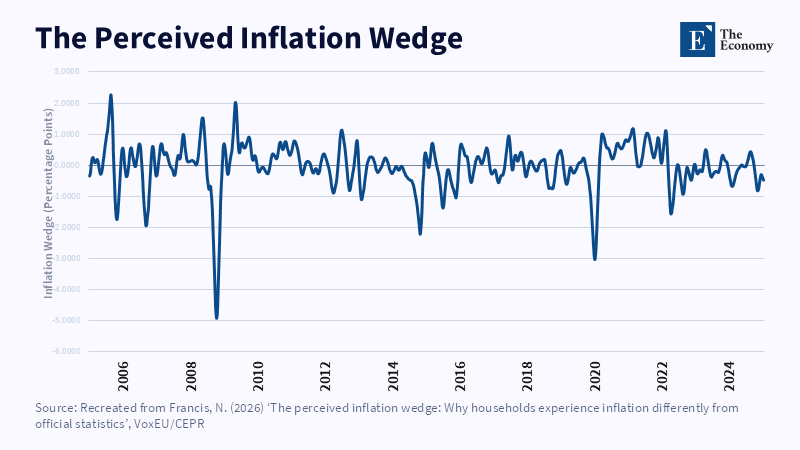
Figure 2:The wedge widens when household price perceptions diverge from official inflation. Related article: Perceived Inflation Is the New Test of Price
Read More
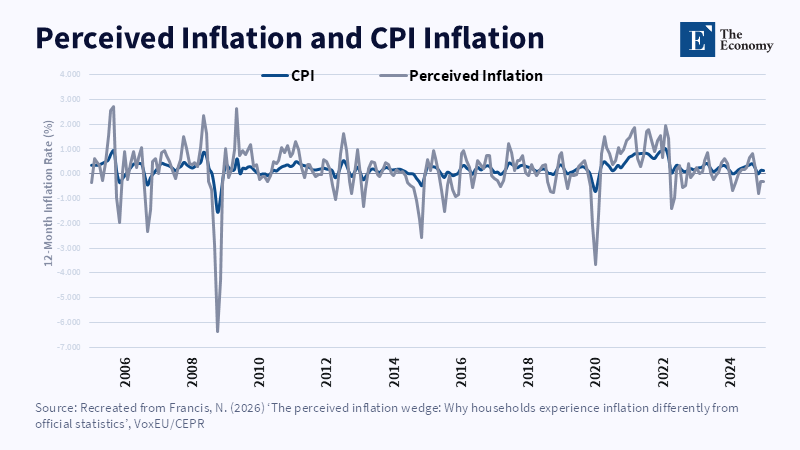
Figure 1: Perceived inflation broadly tracks CPI but reacts more sharply during major price shocks. Related article: Perceived Inflation Is the New Test of
Read More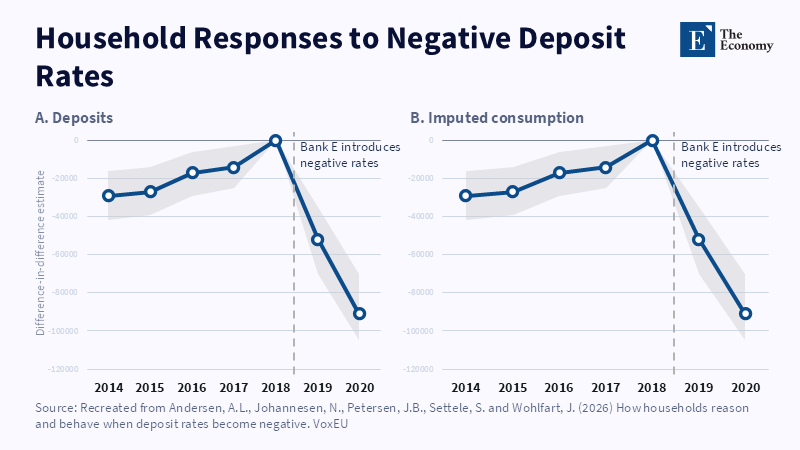
Figure 1: Danish households exposed to negative deposit rates cut deposits sharply while estimated consumption rose after exposure. Related article:
Read More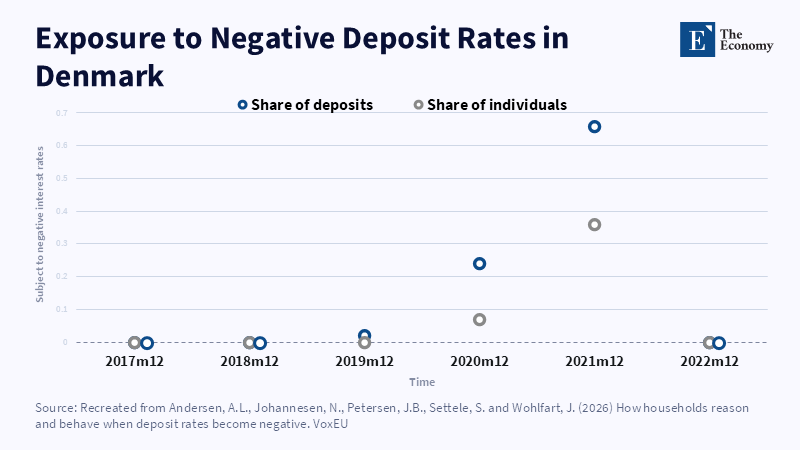
Figure 1: Negative rates spread quickly across Denmark, reaching about one-third of individuals and two-thirds of deposits by late 2021. Related article:
Read More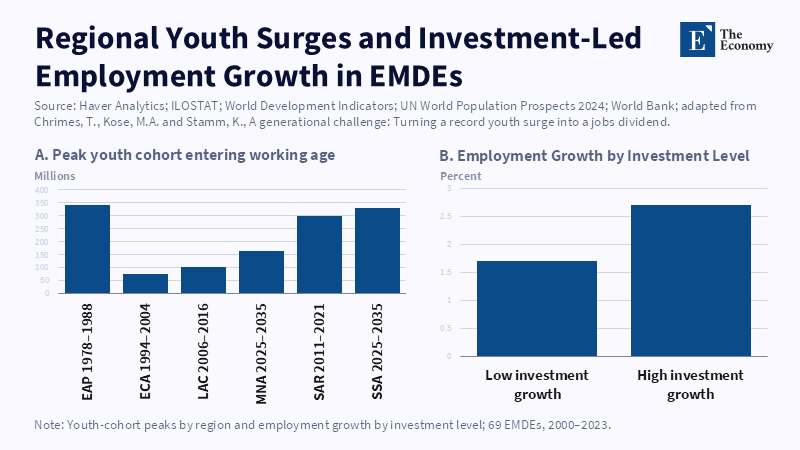
Figure 1: Large youth cohorts become a dividend only when investment turns labour supply into employment growth. Related article: The New Labour Barga
Read More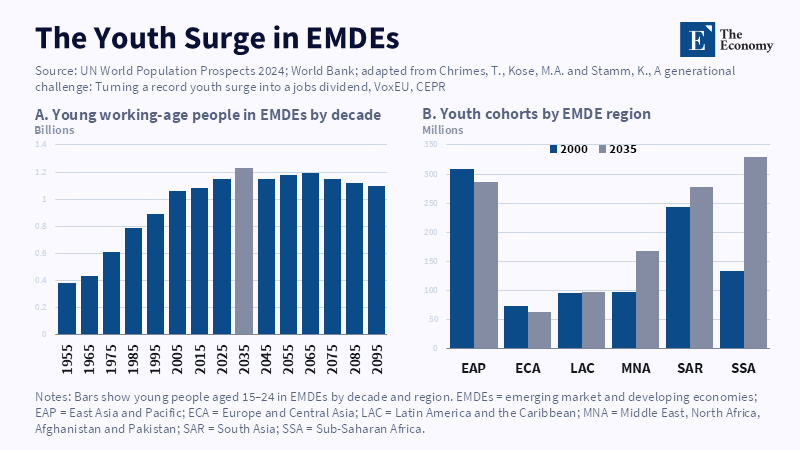
Figure 1: The youth surge is shifting toward South Asia and Sub-Saharan Africa, making EMDE job creation a global labour-market issue. Related article:
Read More